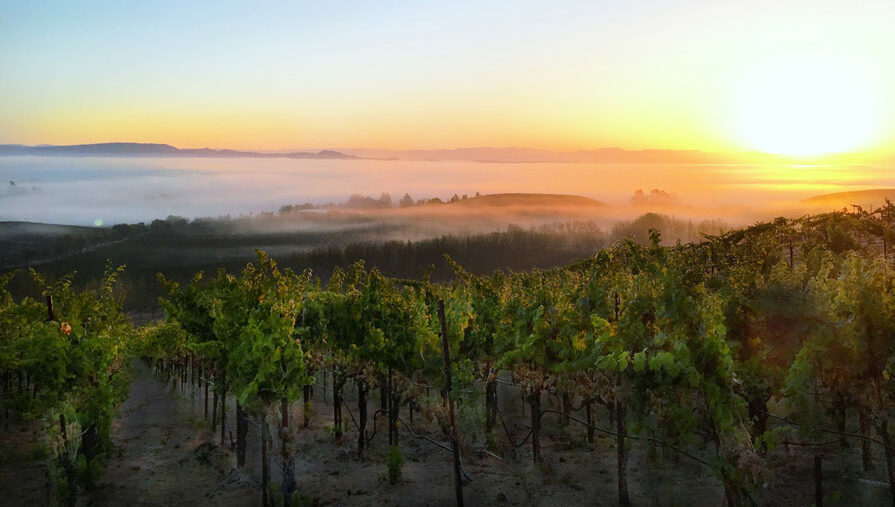
North Fork Valley/West Elks AVA - Photo courtesy of the John Fielder Gallery
Colorado's Wine Growing Regions - Climate comparisons
Have you wondered how the climates of Colorado’s AVAs stack up with other well-known wine-growing regions in the U.S., if not the world?
I have.
Yes, you can talk with knowledgeable Colorado wine folks, read a few books, and dabble with general descriptions and illustrations online.
But what does actual data tell you? I’m a sucker for data. Data informs, it’s powerful. It enables and supports human systems. Its use is boundless and essential in all science and technology-driven ventures.
Over my lifetime I’ve designed and built data systems. The systems run the gambit of my pursuits over the years. They’ve supported political campaigns, private businesses, and government.
You can be creative in data system design. It’s fun.
Now living a life encore growing and making wine, I’m collecting weather data.
When planting my vineyard, I installed a weather station, Tempest by Weatherflow. 3 years of data begins to tell a story. But the story is limited to the vineyard and valley. Providing context across multiple storylines is more informative and meaningful.
How to retrieve data from multiple locations to tell the larger story became my obsession.
Aside from using seasonal weather data to track precipitation, temperatures, wind, etc, why else is it helpful?
Because weather data along a multi-year if not multi-decade timeline defines an area’s climate. Climate is the strongest influencer of growing grapes at the level necessary for creating quality wine*. There are other influencers including soil, topography, and winemaking practices and culture, i.e., “the Terroir” but climate is the foundational element.
With research, I found the NOAA National Centers for Environmental Information website. The NOAA site provides the availability to find and access data from multiple weather stations** across the U.S.—including those located in AVAs.
However, it is challenging to find stations with desired data including daily high and low temperatures as well as precipitation, in locations representative of wine-growing regions.
But I persevered.
With five years of data now in hand from 2019 through 2023, the numbers telling a larger story can be entertained.
Los Carneros AVA, Photo Courtesy Sonoma County - Life Opens Up
My curiosity begins with a commonly used portrayal of the West Elks AVA as a cool grape-growing climate for wine.
West Elks growers over the years have purposely chosen Vitis vinifera grapes that do well in cooler climates (and hybrids as well). Common vinifera grapes planted in the valley include Riesling, Gewurtztraminer, Pinot Gris, Chardonnay, Pinot Noir, and Merlot. They are known as cool to moderate climate wine grapes.
There are cool wine grape-growing climates with centuries of acclaimed history producing world-class wine. Germany’s Mosel River region most known for Riesling (and Pinot Noir – Spätburgunder) comes to mind. Another is the Burgundy region in France, famous for Pinot Noir and Chardonnay.
Mosel River Loop at Leiwen, Mosel Wine Region, Germany - Photo Courtesy of Winetourism.com
America also has several well-known cool wine-grape-growing regions. The wines produced in these areas compete internationally with the world’s best vinifera wines.
One region well known for producing quality Pinot Noir and Chardonnay is California’s Los Carneros AVA, located in southern Sonoma and Napa counties. Oregon’s McMinnville AVA within the larger Willamette Valley AVA raises to the pinnacle of making quality Pinot Noir, and New York’s Cayuga Lake AVA within the larger Finger Lakes AVA does the same with Riesling.
Slightly rephrasing the original question: how does the West Elks AVA grape-growing climate compare to the climates of these three well-known American AVAs? And since I’ve started the conversation “Colorado Centric”, why not add the Grand Valley AVA to the comparison group?
Garfield Estates - Carboy Winery - CO's Grand Valley AVA - Photo Courtesy of the John Fielder Gallery
We should start by defining temperature-based grape-growing climates by classification.
There are four classifications—Cool, Intermediate, Warm, and Hot. While you’ll find slight variations from various reference sources in the classification’s average growing season temperatures, we’ll apply Hugh Johnson and Jancis Robinson’s definition from the 7th Edition of the World Atlas of Wine:
Cool, 55 to 60 degrees F
Intermediate, 60 to 62 F
Warm, 62 to 66 F
Hot, 66 to 70 F.
Using the collected daily data, let’s affirm the classifications our five AVAs comport with.
Exhibit A - Data Sources: personal station for the West Elks AVA and NOAA National Centers for Environmental Information for the remaining AVAs
OR’s McMinnville and NY’s Cayuga AVAs have the coolest growing season of the group, and trend in the lower portion of the Intermediate class. CO’s West Elks AVA ✣ is in the middle of the group trending in the lower portion of the Warm classification. CA’s Los Carneros AVA and CO’s Grand Valley AVA consistently fits the Hot classification, though both dip into the upper reaches of the Warm class for a year or two.
Included in Exhibit A are the growing season averages for Burgundy and Mosel River regions ✣✣. No question, Cool climate all the way.
There is another factor that should be brought to bear potentially moving the climate classifications needle.
The match between NOAA weather station data and what is experienced in vineyards can very well vary from one another.
Vineyards commonly are located in microclimates suited to the grapes being grown. Vineyard sites within the same AVA can experience different climatic conditions.
For example, my vineyard and associated weather station is located on the edge of a mesa, 200 feet off the valley floor—where a portion of the valley’s vineyards are located. My first hand experience owning property both on the mesa and the valley floor, has consistently illustrated a temperature variation between both areas.
Similarly, the weather stations used for this examination are located in each respective AVA but are sited miles away from actual vineyards.
Due to the probable data variance between stations and vineyard locations, using a margin of error of one to two degrees is warranted. Due to how vineyards are typically sited, using a downward push of the margin of error would place OR’s Willamette Valley and NY’s Finger Lakes AVAs in a Cool wine grape growing climate. West Elks would also move more consistently into the Intermediate class, and Los Carneros and Grand Valley into the Warm class.
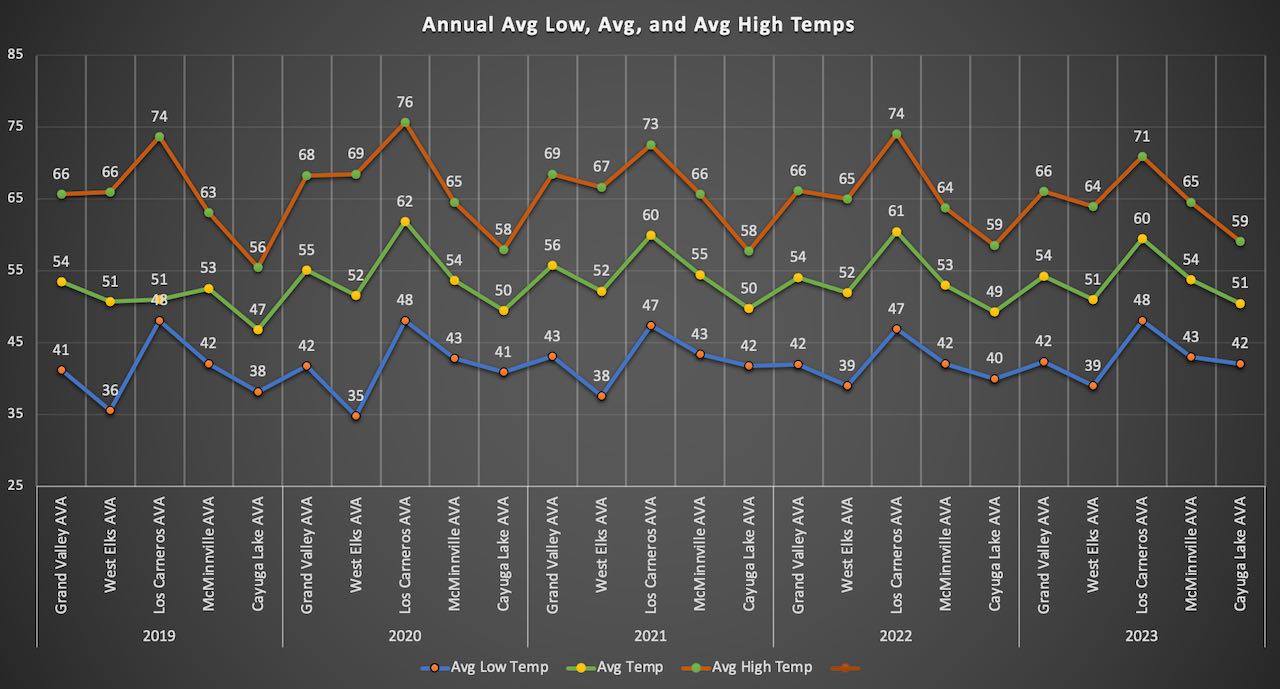
Exhibit B: Annual Temperature Averages
Having examined average growing season temperatures, let’s widen our net and briefly consider annual temperatures—average low, average, and average high.
Los Carneros’ annual average high over the five year span beats all other regions and in most years, has the highest annual average temperature. The region also experiences the highest average low temperatures.
Cayuga experiences the lowest annual average temperatures, including the lowest average highs. West Elks takes the cake every year for average lows, with Cayuga a close runner-up.
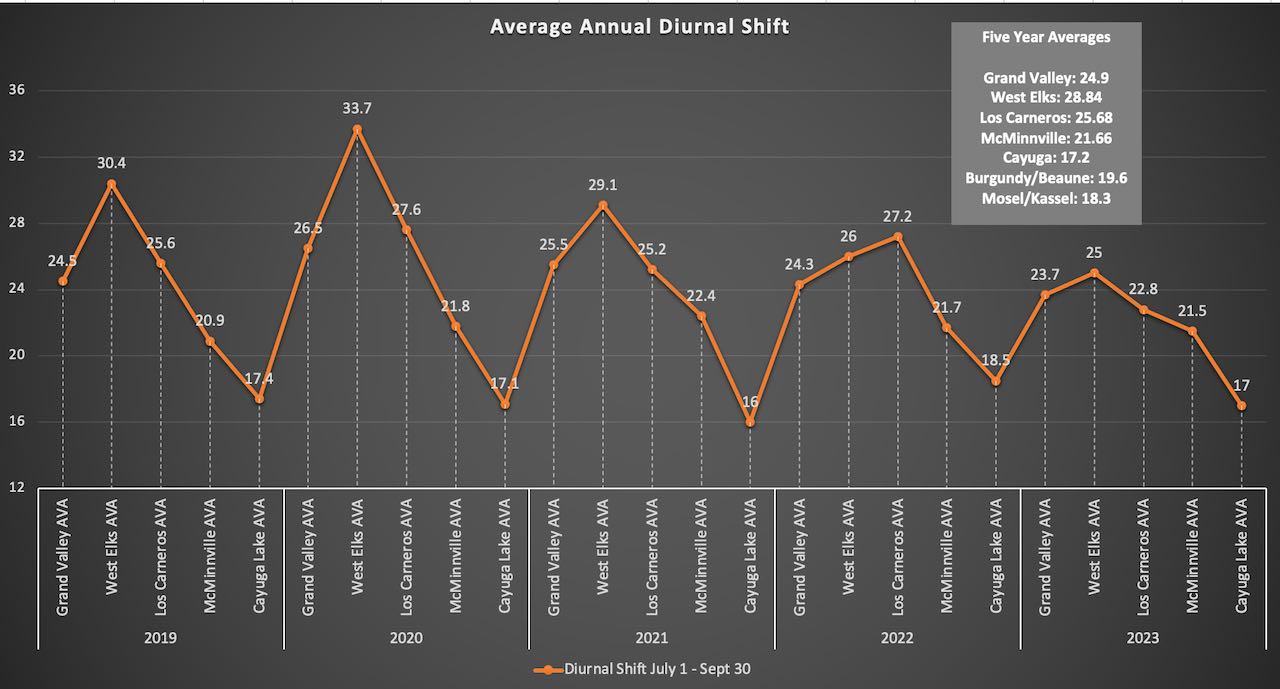
Exhibit C - Diurnal Shift
There is another climatic factor contributing to the production of quality wine grapes—Diurnal Shift, the difference between average nighttime and daytime temperatures as grapes gain sugar.
This is a key factor because notwithstanding the temperature classification of a wine-growing region whether Cool to Hot, having a high diurnal shift facilitates a balance of sugar to acid in maturing grapes. If managed correctly by the winemaker, the balance translates to wines enjoyable to drink.
The average highest diurnal shift as evidenced in Exhibit C, is held four years out of five by the West Elks AVA. Grand Valley and Los Carneros are neck and neck a few degrees behind the West Elks, followed by McMinnville and then Cayuga.
Burgundy and Mosel River regions are on the low diurnal shift scale, similar to Cayuga.
Due to the potential variance of data between vineyards and weather stations as discussed above in relation to average growing season temperatures, a margin of error of one to two degrees can also be applied to the diurnal shift.
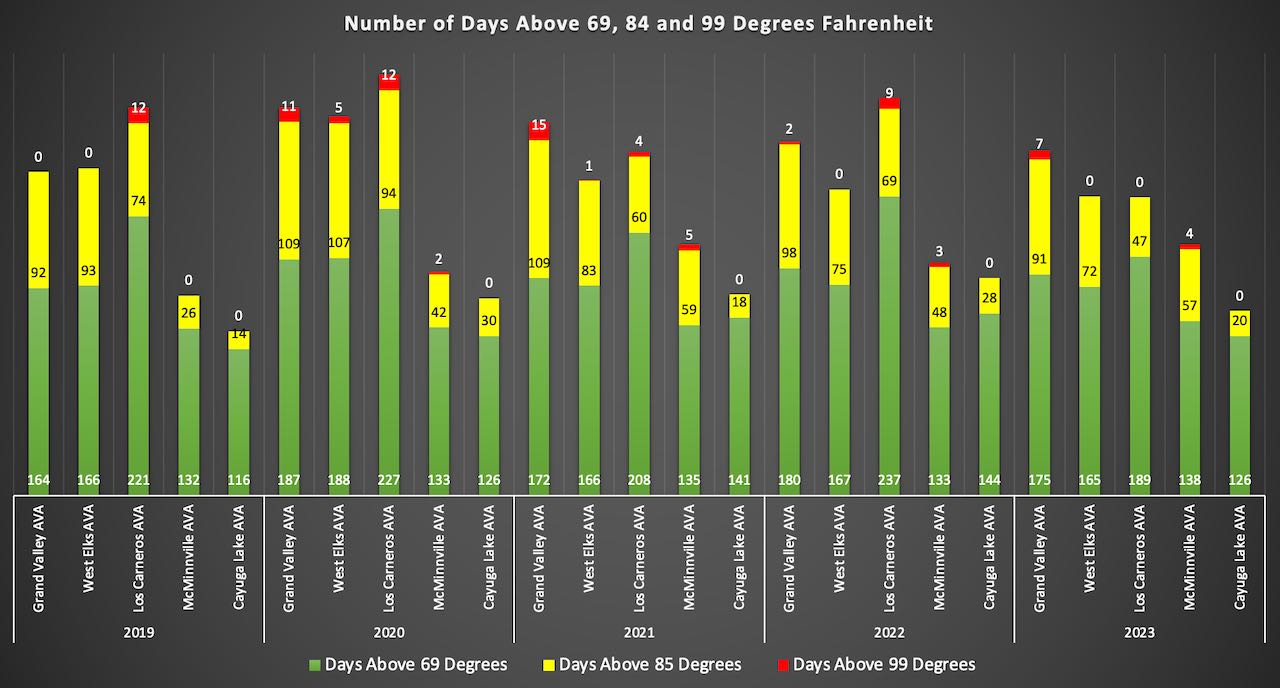
Exhibit D - Total Number of Days Above 69, 84 and 99 Degrees F
Another climatical factor to bring into the mix is the number of days each AVA experiences above 69, 85, and 99 degrees Fahrenheit.
Los Carneros significantly leads the pace in the number of days above 69 degrees in four of the five years. Grand Valley took the crown in 2021. Los Carneros and Grand Valley go back and forth vying for the lead in the above 99-degree category, with the Grand Valley topping the most in 2021 at 15 (Los Carneros had 12 above 99 the year before). McMinnville can’t be left out of the 99+ dynamic, with several days each year except for missing the opportunity in 2019.
McMinnville and Cayuga experience fewer days above 69 than the remaining group. Notwithstanding a few heat spikes for McMinnville, this might be another argument for both regions fitting the Cool wine grape growing climate class.
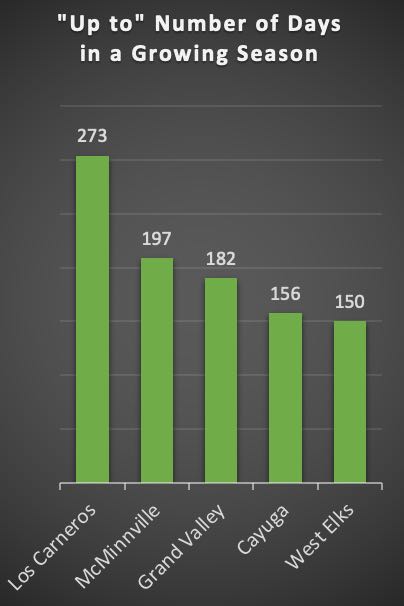
Exhibit E -Data from AVA Websites
A natural segue from the number of days above 69 degrees F, is the number of days in an average growing season.
The influence of the west coast’s moderate maritime climate (i.e., Pacific Ocean) significantly extends the season for Los Carneros and McMinnville. Both Cayuga and West Elks are on the shortest end of the season spectrum.
The chart confirms what I’ve been told as a grower in the West Elks. Grand Valley on average has a longer growing season than the West Elks by three to four weeks. Bingo…
If we’re examining the number of days above 69 degrees and the average length of the growing season, we should also look at the number of days below 31 degrees Fahrenheit.
Exhibit F - Total Number of Days Below 31, 16, and 6 Degrees F
No surprises here, Los Carneros and McMinnville have the lowest number of temps below 31, and none in the below 16-degree category. Once again, the maritime climate influence.
Speaking of climate influences, the Grand Valley, West Elks, and Finger Lakes are affected by a Continental climate, with a much greater variance of cold to hot seasonal temperatures. This is borne out in the data, where there exists high levels of temperatures below 16 degrees and even 6 degrees, with corresponding warm summers. On the cold end, all three regions can at times court temperatures between 0 to -5, which are at the extreme cold end of what can be withstood by vinifera grapes.
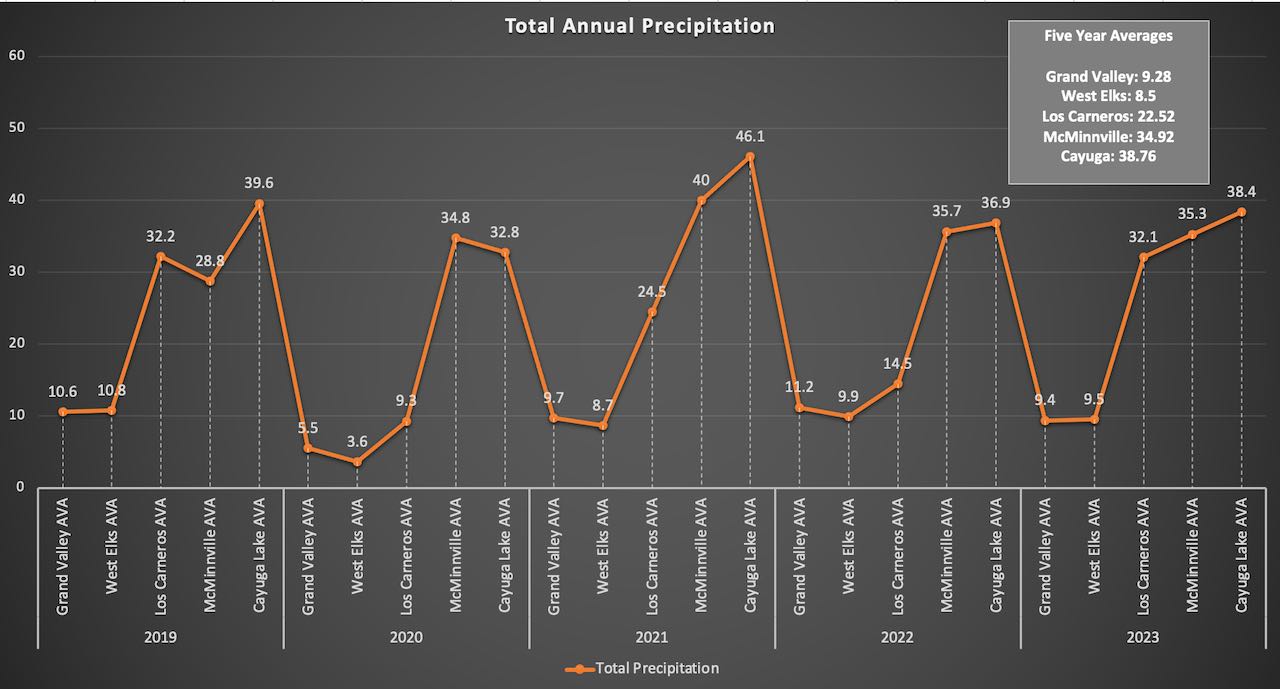
Exhibit G - Total Annual Precipitation
We can’t leave the data without a review of precipitation. This is where you quickly notice the influence of the semi-arid climate of high-mountain valleys with low annual precipitation amounts in the West Elks and Grand Valley. Los Carneros experiences drier years in two of the five. McMinnville and Cayuga receives the most rain, year end and year out.
What are the big-picture Colorado Centric takeaways?
Even though the West Elks doesn’t strictly meet the Cool climate classification for wine growing areas, on average, it’s vies with the Finger Lakes area for the coldest annual region. That being said, of the group studied, West Elks has the highest diurnal shift, highest elevation of a wine grape growing region in North America, temperature peaks rarely breaking 100 degrees Fahrenheit, shortest growing season, and as just referenced, the lowest annual average temperatures.
All to suggest, West Elks wine growers commonly grow and make wine with cool climate grapes for a reason.
The data also points to the reason the Grand Valley AVA—also a high elevation grape growing region right behind the West Elks—can grow warmer climate grapes (Cabernet, Sauvignon, Syrah, Malbec and others) to maturity notwithstanding the Continental climate influence. Grand Valley’s unique microclimate is warmer on-par with CA’s Los Carneros AVA. Grand Valley doesn’t have the longer growing season with modest annual temperatures experienced by Los Carneros and McMinnville but it has the temps required to get the job done.
Further, Grand Valley has the diurnal shift on par with Los Carneros necessary to keep both grapes and finished wines balanced.
I’d like to provide a nod to a climate force not referenced in the collected data in this exercise—anthropogenic (human-caused) climate change. Climate change effects on wine-growing regions are extensively researched and documented. To contend with the challenge, viticultural and winemaking approaches are evolving.
I’ve dedicated a Flipboard site to document climate change and the wine industry.
Five years of weather data doesn’t provide the necessary context to examine the topic. It requires decades of documentation—documentation now providing scientific proof of anthropogenic change.
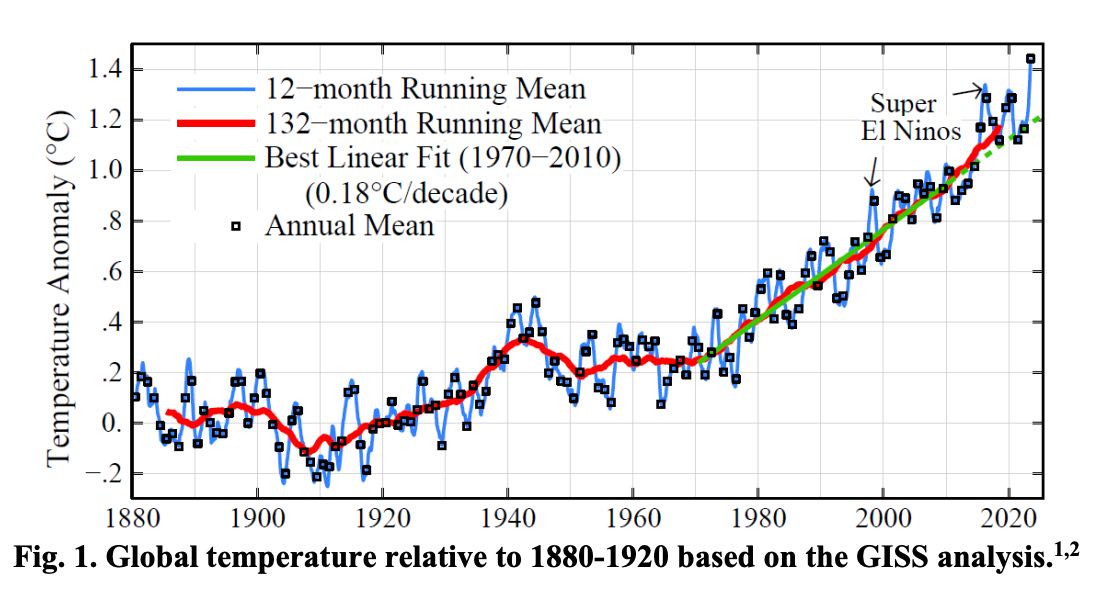
My go-to regarding climate science is the work of Dr. James Hansen (now affectionally referred to as the godfather of climate change), who first brought climate change to the public consciousness with his testimony to the US Senate in 1988. His work with Climate Science, Awareness and Solutions at Columbia University has set the scientific pace for providing the necessary past, present, and future context required to better understand our changing climate.
Chart courtesy James Hansen and Makiko Sato
Lastly, extreme weather events whether climate change-induced or not, play a role in wine-growing and winemaking decisions. This has been acutely experienced with regional droughts, wildfires, and exceptional temperature events over the past several years. There are two cases where climate change rears its ugly head in the data.
In late June 2021, the Pacific Northwest experienced a heat dome for the record books. The weather station at McMinnville recorded three days of successively high temperatures peaking at 104, 111, and 114. Analysis of the event pointed to the effects of climate change as a causal factor.
Colorado’s AVAs experienced two nights of abrupt 14 and 9 degrees nighttime lows in late October 2020, after experiencing a fairly mild fall. 60 – 90% of vinifera vines that hadn’t had a chance to harden off for the coming winter were killed to the ground. While this event isn’t causal to climate change, extreme weather shifts are expected to increase in our new warming climate world.
Hillick & Hobbs Vineyard - Finger Lakes AVA - Courtesy Finger Lake Alliance
To sum things up, I’ve very much enjoyed this exercise.
As referenced in the opening discussion introducing this topic, the strongest influence on quality wine-growing is climate. Being able to compare and contrast the valley I’ve chosen to grow and make wine against other locations, including those well-known and held up as making the world’s greatest wine—is powerful.
Knowledge is powerful.
Data informs knowledge.
Knowledge informs actions.
Just ask your local viticulturist and winemaker!
*For a layperson’s perspective on wine-growing climates see this link. For an in-depth discussion and analysis, you can’t do better than this.
**The data used for this exercise included daily low and high temperatures and precipitation. Weather stations are searched using various locators whether county, city, zip code, or station name. Careful attention is required for stations returned from a search. Many stations contain partial data sets with missing dates or don’t contain the desired combination of temperatures and precipitation. I had hoped to include wind, solar radiation, and UV data but their availability was too limited.
✣ West Elks AVA data is represented by a weather station in my vineyard on Sunshine Mesa, approximately 200 feet off the valley floor. Careful observers may note that I referenced the weather station has to date collected three years of data. Yet, there are five years reported in the exhibits. For 2019 and 2020, I used data from a weather station in another location outside the AVA in Delta County.
✣✣ Data for Burgundy and Mosel River regions are taken from the Weather Spark website. At Weather Spark, you can look up climate factors by City, which provides the average high and low temperatures by month. Eight to 10 years of data is used to provide the averages.
Photo Courtesy Willamette Valley AVA
2 thoughts on “CO’s Wine Growing Regions – Climate Comparisons”
Cindy Snalam
Marshall
I read this entire article and was just amazed at your detailed data analysis. I really appreciate it because I’m very interested in Wine growing regions, climate change, and Weather patterns.
. I should mention that I went to Ithaca College so I was living in that wine region for four years on Cayuga Lake. I should also say I was never impressed with the wine that was grown there, but since winemaking has become so much more advanced, I’m sure the wine has gotten better – as it has in the Colorado wine growing regions.
I’m looking forward to visiting you this summer.
Thanks for your comment and observation about the Finger Lakes. Absolutely, western NY as with many small winemaking areas have upped their games the past 20 years!