Three Years of Weather Data on Sunshine Mesa
I now have three years of vineyard weather data on Sunshine Mesa in western Colorado.
Enough data to consider trends. Not enough for making gross pronouncements.
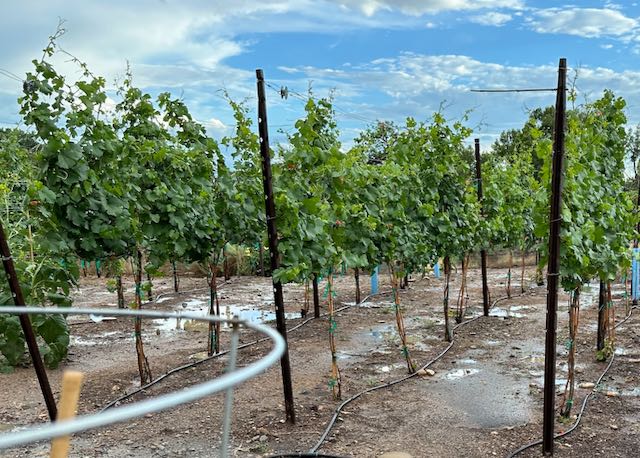
After planting 125 vines in spring 2021, I installed a Tempest weather station in early 2022.
The station is perched 8′ high in one corner of the vineyard. The Tempest is solar-powered with Wi-Fi capability. I can access real-time and historical data from my phone. I also provide data from the station’s website (North Fork Winery – Sunshine Mesa), via a weather icon in the header of my website (scroll up!)
Why is Weather Data Important?
As you undoubtedly know, being attentive to daily weather informs human actions. Such as what to wear. Your activity for the day. Preparations for an upcoming weather event.
More specific to the vineyard, when to engage in various agricultural pursuits, whether tilling, planting, pruning, spraying, or harvesting.
Another crucial role in documenting and tracking weather data is that it provides information about the climate. The climate describes average weather patterns over a long period in an area, encompassing trends in temperature, precipitation, wind, etc.
As NOAA’s National Ocean Service states, “Climate is what you expect, weather is what you get”.
Several factors are involved in tending to a vineyard to produce the best possible grapes for winemaking: climate, soil, location, property pruning practices, and water management.
Climate plays the largest role, advising vineyard location, grapes to plant, and annual agricultural requirements. Under the “climate umbrella,” weather informs the day-to-day considerations.
Regions, Subregions, and Microclimates
In early 2024, I wrote a climate comparison blog.
In it, I analyzed data from five wine-growing areas defined as AVAs (American Viticultural Area). Two in Colorado, and three additional in California, Oregon, and New York.
The blog used five years of data from NOAA’s online climate data sets. I came to several conclusions and comparisons between the five regions, which is not the topic of this post.
However, one item worth mentioning is my observation that using NOAA’s data is fixed to the weather station’s location, not specific to surrounding subregions with unique microclimates and associated vineyards.
For anyone who has visited the many vineyards located in larger wine-growing regions and AVAs in the world, individual microclimates are a quintessential topic of discussion when discussing what makes individual wines unique.
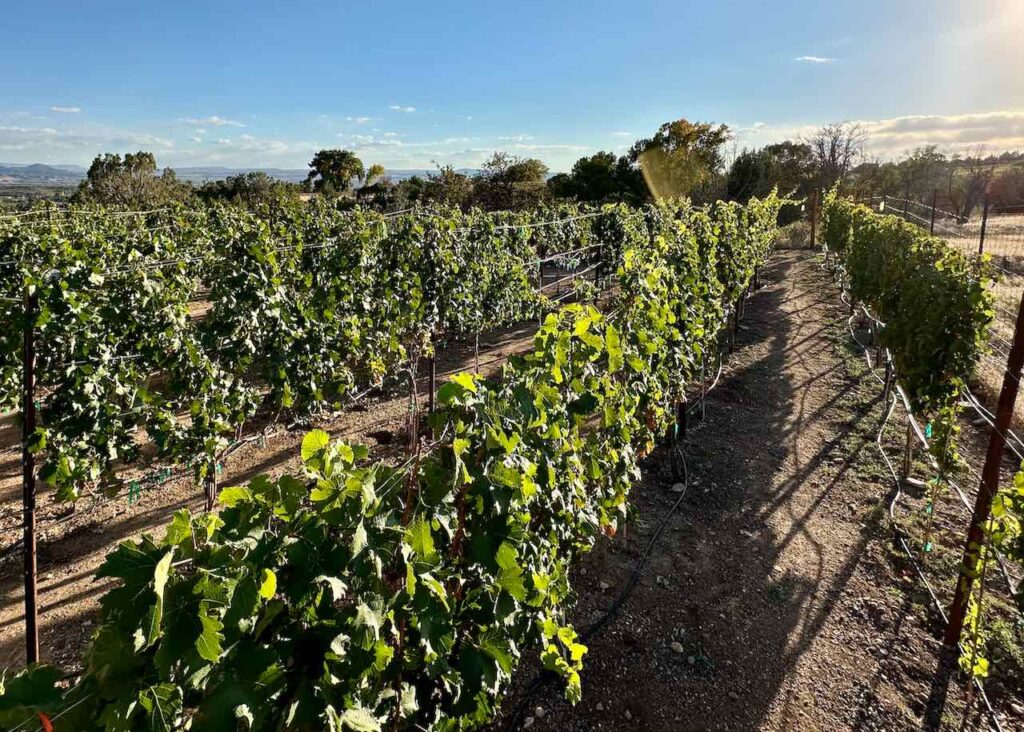
This examination is of a microclimate. One vineyard, located on Sunshine Mesa in the North Fork Valley, of which the West Elks AVA is located.
There are several microclimates in the West Elks AVA, including on several mesas like mine (Rogers, Hansen, Pitkin, Lamborn, and more) and in various locations along the valley floor, wherein the North Fork of the Gunnison flows.
My long-term interest is growing the capability of comparing weather short-term and climatical long-term dynamics between various microclimate sites around Colorado.
A project I plan to pursue in 2025.
The Data
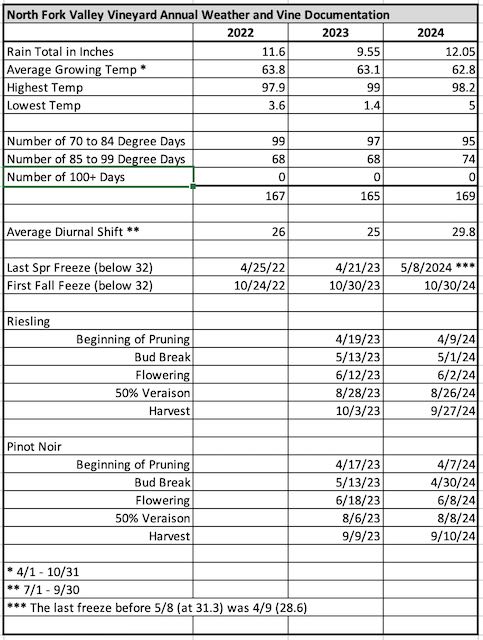
Below is a three-year data table from my weather station, providing details on weather seasonal averages, data points, and seasonal grape growing stages. As referenced at the beginning of the post, three years is not enough time to establish trends. Five to 10 years should move the needle further.
This doesn’t mean you can’t learn from the data—that’s the point of the exercise!
It would be good before I make a few data-specific observations, we highlight a few cogent items:
- The diurnal shift is the difference between a day’s high and low temperatures. The higher the shift (upper 20s to upper 30s), the better the grapes retain a preferred sugar and acid balance for winemaking.
- The five grape vine growing stages are well-established seasonal grape development milestones. Essential to track to assist in vineyard task planning and managing expectations.
- Data is missing for the vine growing stages in 2022 because as a second year vineyard, there were no grapes.
Data Observations
The big picture is rather anticlimactic: the temperatures and rain totals are consistent over the three years and don’t wildly swing.
However, having lived much of my adult life in Denver along the east side of the Rockies where the cold north arctic masses settle, I’m pleasantly surprised the highs only reach the upper 90s (not broaching 100), and the lows remain above 0. This speaks to the microclimate we have in our west of the Rockies valley—even at 5,400 to 6,000 feet elevation.
Depending on the source, annual rainfall ranges from 10 to 14 inches annually in the valley. My vineyard resides in the lower-middle of the range, with an average yearly amount of 11 inches. Once again, no wild swings.
I don’t doubt temperature extremes will occur next year or soon thereafter. Documenting the degree (no pun intended) and the number over a more extended period is where the value lies.
The dates for spring’s last and fall’s first freezes are within a week of one another over the three years, with one exception. This past spring.
With a freeze on April 9 at 28.6, the weather moved to a mild pattern well into early May. You’d be forgiven if you thought a freeze was behind you at this point, but it was not when May 8 rolled around. The tips of many of my vines took a hit that early morning.
Lastly, the difference from 2022 to 2024 of 3.8 degrees in the diurnal shift is worth noting, considering the data consists of averages. However, the shift dipped one degree in the intervening year, so the average over the three years was 26.9 degrees. You could say the shift is on an upward trajectory—a good thing for the grapes and winemaking—but there isn’t enough data to establish a climatic trend.
Near Extreme Weather Events
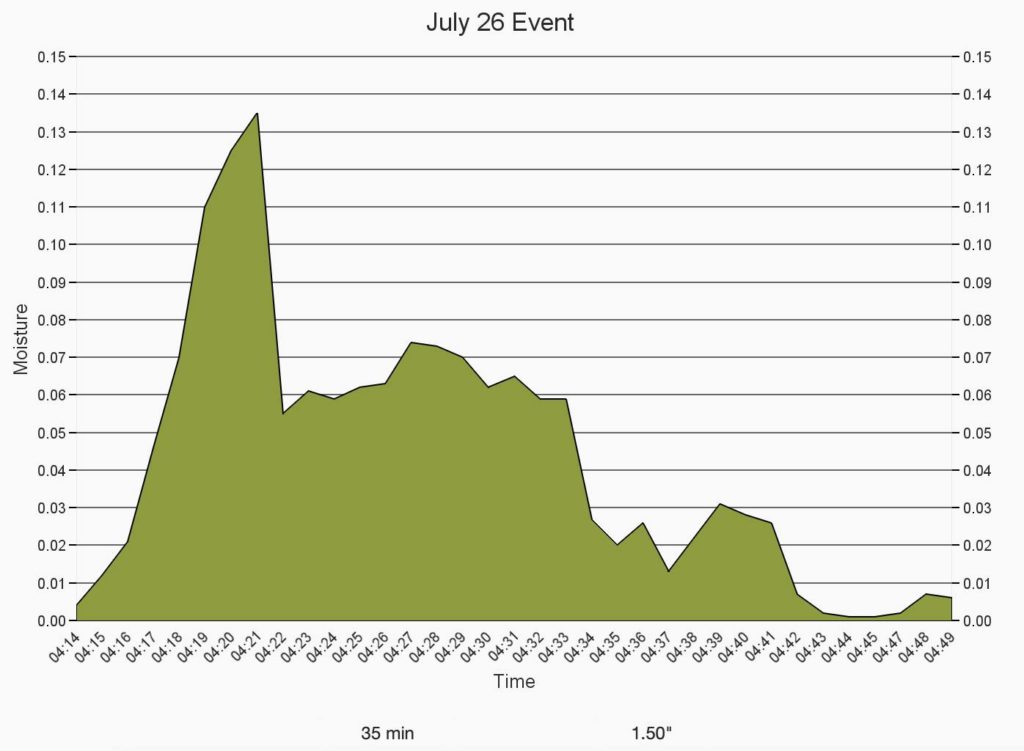
Extreme weather events are not reflected in the data table. There have been two “near” extreme events in the past three years—the events could have been worse.
First, a downpour one July afternoon two years ago of 1.5 inches in 35 minutes. The result was heightened erosion in the vineyard and around the property.
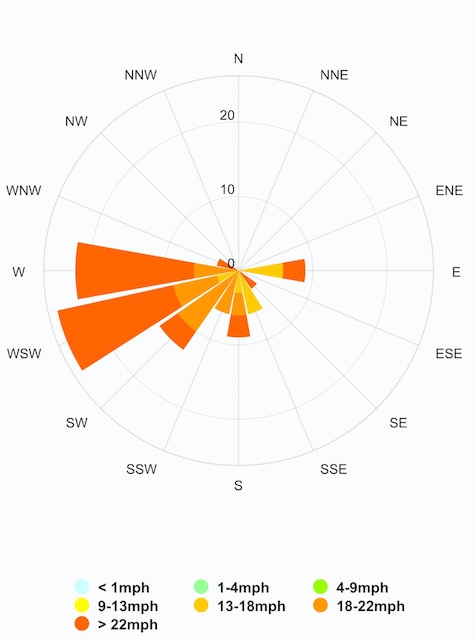
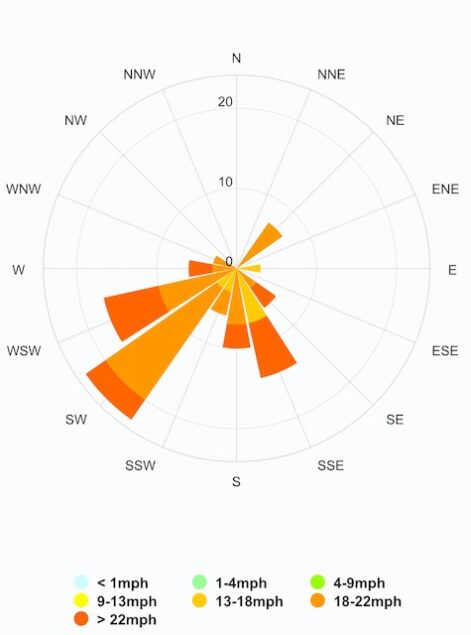
Second, extreme winds in late May and early June this year resulted in “flower shatter”: the destruction of grape cluster flowers. Being on the edge of Sunshine Mesa can be consistently windy at times. But May and June were extraordinary. The consistency of high winds reduced my harvest by approximately 20% and has me considering the installation of a light tarp wind barrier next year.
Conclusion
I look forward to continuing to track the weather associated with my vineyard to inform daily activities and identify climatic trends. In 2025, I plan to expand my weather and climatical net to incorporate reporting from several locations within Colorado’s two AVAs and other places in Colorado as they present themselves.
Let’s see where the data takes us and how it can be used to better our wine-growing efforts!


